ArcelorMittal South Africa Annual Report 2009
Review at a glance
Year ended 31 December
2009
Rm
2008
Rm
2007
Rm
2006
Rm
2005
Rm
GROUP INCOME STATEMENT
Revenue
25 598 39 914 29 301 25 350 23 984
(Loss)/profit from operations
Flat Carbon Steel Products
(614)
7 007
4 827
3 644
4 518
Long Carbon Steel Products
315
3 672
2 652
2 111
2 109
Coke and Chemicals
449
1 743
727
184
301
Corporate and other
79 (263)
(503)
143
(34)
229 12 159
7 703
6 082
6 894
(Losses)/gains on changes in foreign exchange
rates and financial instruments
(813)
637
(131)
301
246
Net financing (cost)/ income
(77)
80
325
193
(29)
Income from investments
3
3
4
7
5
Income from equity-accounted investments
(net of tax)
206
331
270
135
277
Income tax expense
(35) (3 865) (2 455) (2 022) (2 327)
Impairment reversal
9
36
Adjustments to attributable income for
headline earnings
38
103
25
34
25
Headline (loss)/earnings
(440)
9 4845 7414 730
5 091
Headline (loss)/earnings per share (cents)
(104)
2 128
1 288
1 061
1 139
Dividends per share (cents)
707
429
347
380
GROUP STATEMENT OF CASH FLOWS
Cash flows from operations
1 693 5 578
4 623
3 463
2 616
Sale of assets
2
8
9
6
Capital expenditure
(914) (1 832) (1 852) (1 446) (1 608)
Investments
(524)
(16)
Other
91
17
108
174
43
Net cash flow before finance activities and
repurchase of shares
346
3 765
2 871
2 200
1 057
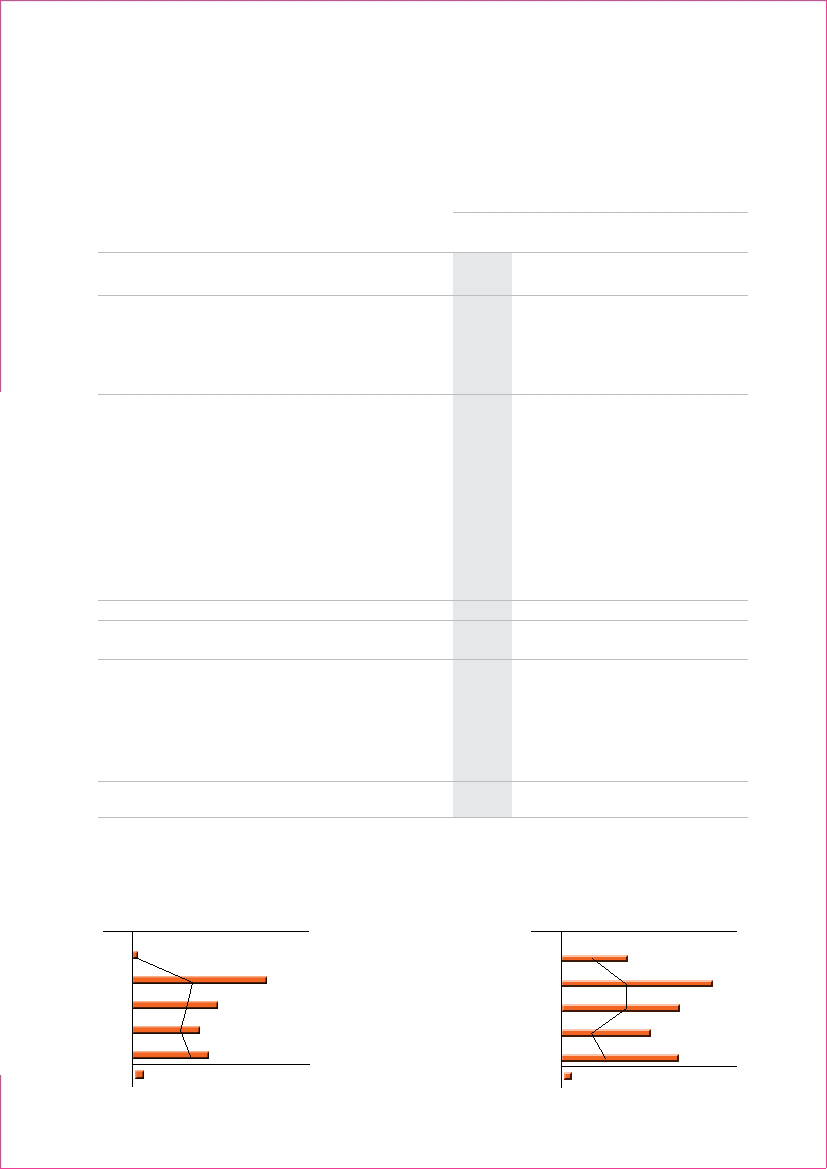
Operating income and
operating margin
2009
2008
2007
2006
2005
Operating income (Rm)
Operating margin (%)
229
12 159
7 703
6 082
6 894
Cash ow from operations
and capex (Rm)
2009
2008
2007
2006
2005
Cash flow from operations before
Capex
4 706
11 006
8 439
6 326
8 407